Tordera catchment
Land use: land use map for 2019.
The basin is mostly covered by forest, being around of 80% of the surface. 11% of the basin is covered by agricultural activities, concentrated in the medium zone of the basin and the delta area and 9% of the basin is covered by urban and industrial areas, with a higher presence in the coastal line (Based on Copernicus Land Monitoring Services).
The land use cover map can be simplified, merging uses that are similar or under the same category. The detailed land uses observed are explained in the next list:
- Artificial surfaces
- Discontinuous urban fabric
- Industrial or commercial units
- Mineral extraction sites
- Sport and leisure facilities
- Agricultural areas
- Non-irrigated arable land
- Pastures
- Complex cultivation patterns
- Forest
- Broad-leaved forest
- Moors and heathland
- Beaches, dunes, sands
- Wetlands
- Inland marshes
Soil type: soil is mostly divided in 3 zones composed of different materials. Igneous and metamorphic materials (Montseny mountain, Montenegre and Selva Marítima), alluvial sedimentary material not consolidated and alluvial material in the last part of the river and its mouth (Based in local information obtained from the Catalan Geological Service).
As showed in the map, a simplification and merging of soil types is presented. A detailed classification of the soils according to the USDA soil taxonomy guide of the basin, is explained in the following list:
- Udorthent
- and Humudept lithic
- Ustorthent
- and Hapluctoll lithic
- Xerorthent
- Xerorthent typical
- Xerorthent lithic
- Haploxeret typical
- Haploxeret calcic
- Haploxerept
- Haploxerent fluventic
- Calcixerept typical
- Xerofluvent typical
- Xerofluvent
- Xerorthent typical
- Xerofluvent oxyaquic
- Xeropsamment oxyaquic
- Haploxeroll
- Haploxeroll lithic
- Haploxeroll calcic
Historical events in the area
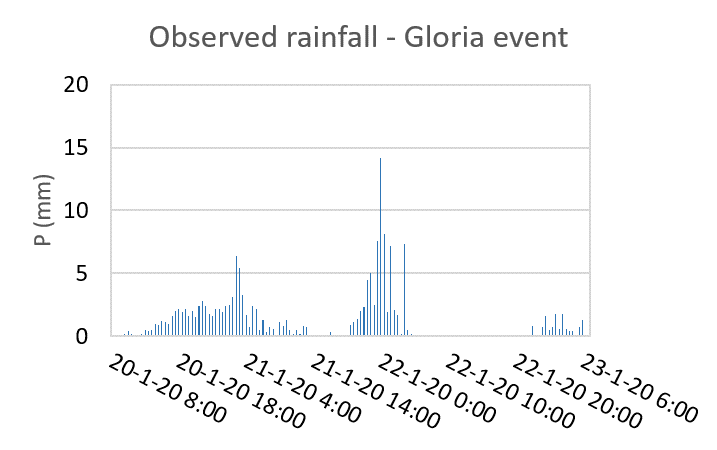
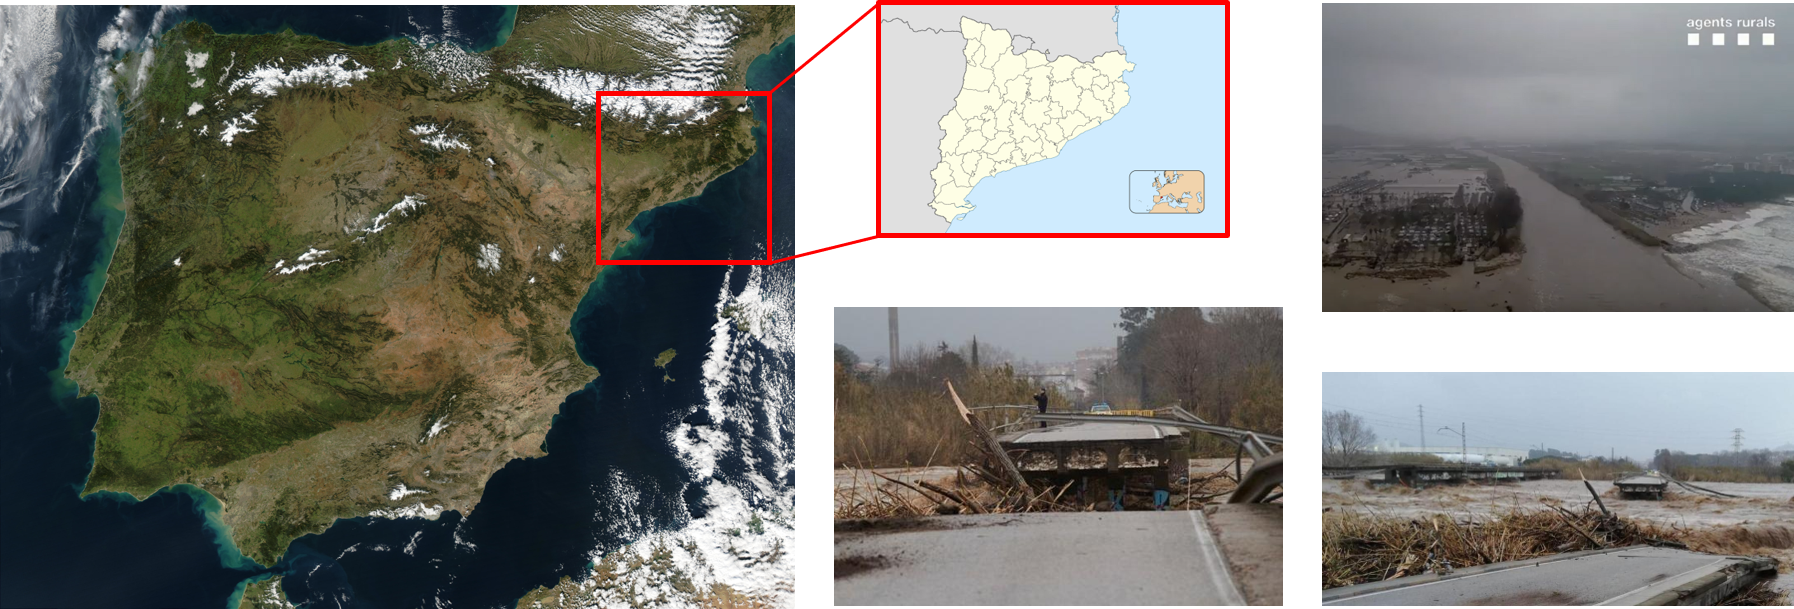
A high intensity storm was registered in January 2020. The event – named Gloria – affected a vast area of the Catalan coast in Spain. The event has a duration of 3 days, leaving heavy rainfall that reached up to 500 mm in some part of the zone.

The storm caused floods in the lower part of the catchment, mainly at the river’s mouth of “La Tordera“. These floods affected agricultural and urban areas, reaching water depth between 0.1 and 1 m (see the flood maps). Some of the roads were interrupted. Roads and railway bridges, that connect Barcelona with some locations of the Catalan coast, were destroyed.

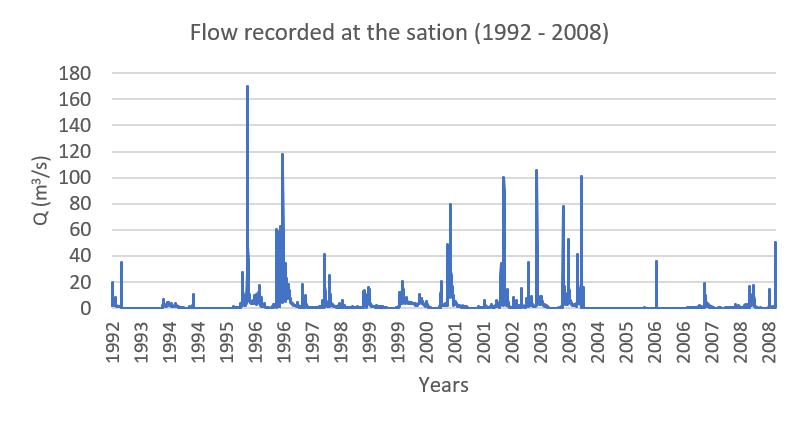
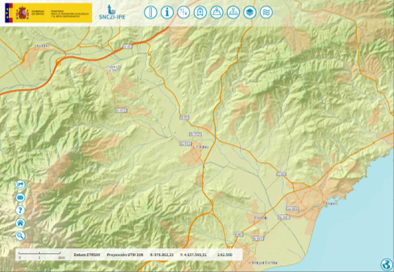
During the Gloria event, the flow was recorded at the “Fogars de la Selva” discharge gauge. This station (see map information above) is located approx. 14 km upstream the river mouth and gives minutes measurements of the discharge under different flow regimes.

During the event, the station registered a peak discharge around 700 m3/s.
Using the bidimensional hydraulic tool, Iber, a model was built to simulate the hydrodynamics of the river using the hydrograph registered at “Fogars de la Selva” during the Gloria event. The results of the model allowed to understand the extension of the flood, the depth and velocities generated by the event in the study area (see map information above).
The calculation of the Maximum Hazard was done using the methodology proposed by the Water Catalan Agency (ACA).
Design flows
In hydrology and hydraulics, the frequency analysis (FA) of events and the intensity associated to them, is crucial to evaluate how an event of specific characteristics can affect a specific area. At the same time, it allows planners and engineers to design hydraulic infrastructure, which is vital for the development of settlements and cities.
In general, a specific zone has been study statically using hydrometeorological data. This process allows having important information of the duration, intensity and frequency of hydrometeorological phenomena (e.g. discharge).

The objective of FA of hydrologic data is to relate the magnitude of extreme events to their frequency of occurrence through the use of probability distributions. The results of flood FA can be used for many engineering purposes: for the design of dams, bridges, culverts, and flood control structures; to determine the economic value of flood control projects; and to delineate flood plains and determine the effect of encroachments on the flood plain (Chow et al., 1988).
Following the definitions above, it can be derived a new term, which is the Return Period (T) that can be defined as the average time in what an event of a specific magnitude may occur.
For the statistical analysis of the “La Tordera” river, the same hydrodynamic tool (Iber) used for the analysis of the historical situation (Gloria) was used. In this case, information obtained from the “Sistema Nacional de Cartografía de Zonas Inundables (SNCZI)” that provides the maximum discharges occurring in the river for different return periods. In this case, the case of study was analysed using T= 50, 100 and 500 years.

Using the 2D river dynamic tool, Iber, depth and velocity were simulated (see map above, design flow layers).
- Depth_T50: flow depth for a 50-year return period.
- Depth_T100: flow depth for a 100-year return period.
- Depth_T500: flow depth for a 500-year return period.
- Velocity_T50: flow velocity for a 50-year return period.
- Velocity_T100: flow velocity for a 100-year return period.
- Velocity_T500: flow velocity for a 500-year return period.
